Air Quality Monitor
Project description
There are many commercial devices available that perform air-quality detection and monitoring. This prototype uses high-quality, professional/commercial-grade sensors to measure temperature, humidity, carbon dioxide (CO₂), and particulate matter (PM1.0, PM2.5, PM10). It also includes an accelerometer, which could later be used to detect vibrations and help predict events such as seismic activity (sending alerts or triggering emergency automation) or appliance monitoring — for example, detecting when a washing machine or dryer finishes its cycle based on vibration (many smart plugs infer this indirectly, but vibration sensing is a more direct method).
At this time, the prototype does not have a sensor that detects Volatile Organic Compounds (VOCs) such as formaldehyde or ethanol. This is because VOC measurement is generally not required to calculate the official outdoor Air Quality Index (AQI) used by the U.S. Environmental Protection Agency (EPA).
A carbon monoxide (CO) sensor is also not included. CO sensors used in commercial alarms (such as Nest or Kidde) are electrochemical, factory-calibrated, certified, and have specific expiration dates. Their accuracy is high, but they require proper calibration and certification to be considered reliable. Other low-cost CO sensors exist, but they tend to be much less precise, often varying ±20–30% or more unless calibrated against a known reference gas.
The prototype does not include a display. Instead, it uses the ESP8266 ESP-01S serial transceiver module (running the default AT firmware) to transmit telemetry over the local area network (LAN). The companion mobile app’s discovery service scans the local subnet for a TCP server on port 5001.
By default, the AT firmware on ESP8266 modules supports up to 4 simultaneous TCP clients (IDs 0–3). To increase this limit, the firmware must be replaced, which requires using an ESP-01 programmer to flash new firmware onto the module.
The mobile app parses the incoming telemetry JSON and displays AQI, temperature, humidity, CO₂, and particulate matter (PM1.0, PM2.5, PM10).
Components and supplies
Sensors (NOTE: Some links may not be valid anymore)
- BME280 (temperature / humidity / pressure, I²C/SPI) Link: BME280 (Adafruit)
- PMSA003I (air quality PM1.0, PM2.5, PM10.0 laser particle sensor, I²C version) Link: PMSA003I (Adafruit)
- LIS3DH (triple-axis accelerometer, I²C/SPI) Link: LIS3DH (Adafruit)
- Senseair S8 (CO₂ sensor, 5V supply, 3.3V-logic UART) Link: Senseair S8 (CO2Meter) Link: Senseair S8 (Mouser)
Wi-Fi board
- ESP8266 ESP-01S (serial transceiver module, UART) Link: ESP8266 ESP-01S (Amazon) You can also get it with programmer: Link: ESP8266 ESP-01S with programmer (Amazon)
Micro-controller board
- STMicroelectronics NUCLEO-F411RE (ARM STM32 Nucleo-64 development board STM32F411RE MCU) Link: NUCLEO-F411RE (Mouser)
Power
- 5 V wall supply (5V / 2.4A AC adapter) Link: 5 V wall adapter (Amazon)
- Panel-mount DC jack (5.5mm / 2.1mm, Switchcraft 712A) Link: Panel-mount DC jack (Mouser)
Electronic components
Voltage regulator- TSR 1-2433 (TRACO Power DC/DC Converter, 4.75V-36V to 3.3V) Link: TSR 1-2433 (Mouser)
- Pull-ups (4×) — 10 kΩ, ¼ W
- Series resistor (4×) — 1 kΩ, ¼ W (any through-hole)
- Series resistor (1×) — 220 Ω, ¼ W (any through-hole)
- Bulk capacitor (1×) — 100 µF electrolytic, 10 V radial
- Bypass capacitor (2×) — 0.1 µF ceramic (any 0.1 µF 50 V MLCC)
- Piezo Buzzer PS1240: A piezo buzzer that plays tones from 3 V to 30 V; easy to drive via PWM or tone functions, and softer than resonant ‘beeper’ buzzers Link: Piezo Buzzer PS1240 (Adafruit)
Enclosure
- 1591XXEGY (Hammond Manufacturing, Box ABS Gray, Cover Included, 7.615" L x 4.465" W) Link: 1591XXEGY (DigiKey)
- M2.5 nylon standoffs and screws to mount boards Link: M2.5 nylon standoffs and screws (Amazon)
PCB boards
- ElectroCookie mini PCB prototype boards were used to mount the sensors and electronic components Link: ElectroCookie mini PCB prototype boards (Amazon)
Development environment
- STM32CubeIDE - Eclipse-based ST’s official IDE Link: Integrated Development Environment for STM32 - STM32CubeIDE (ST) Link: STM32Cube initialization code generator (for pinout customization and other configuration) - STM32Cube initialization code generator (ST)
- Flutter – multi-platform IDE, single code base Link: Flutter
The schematic
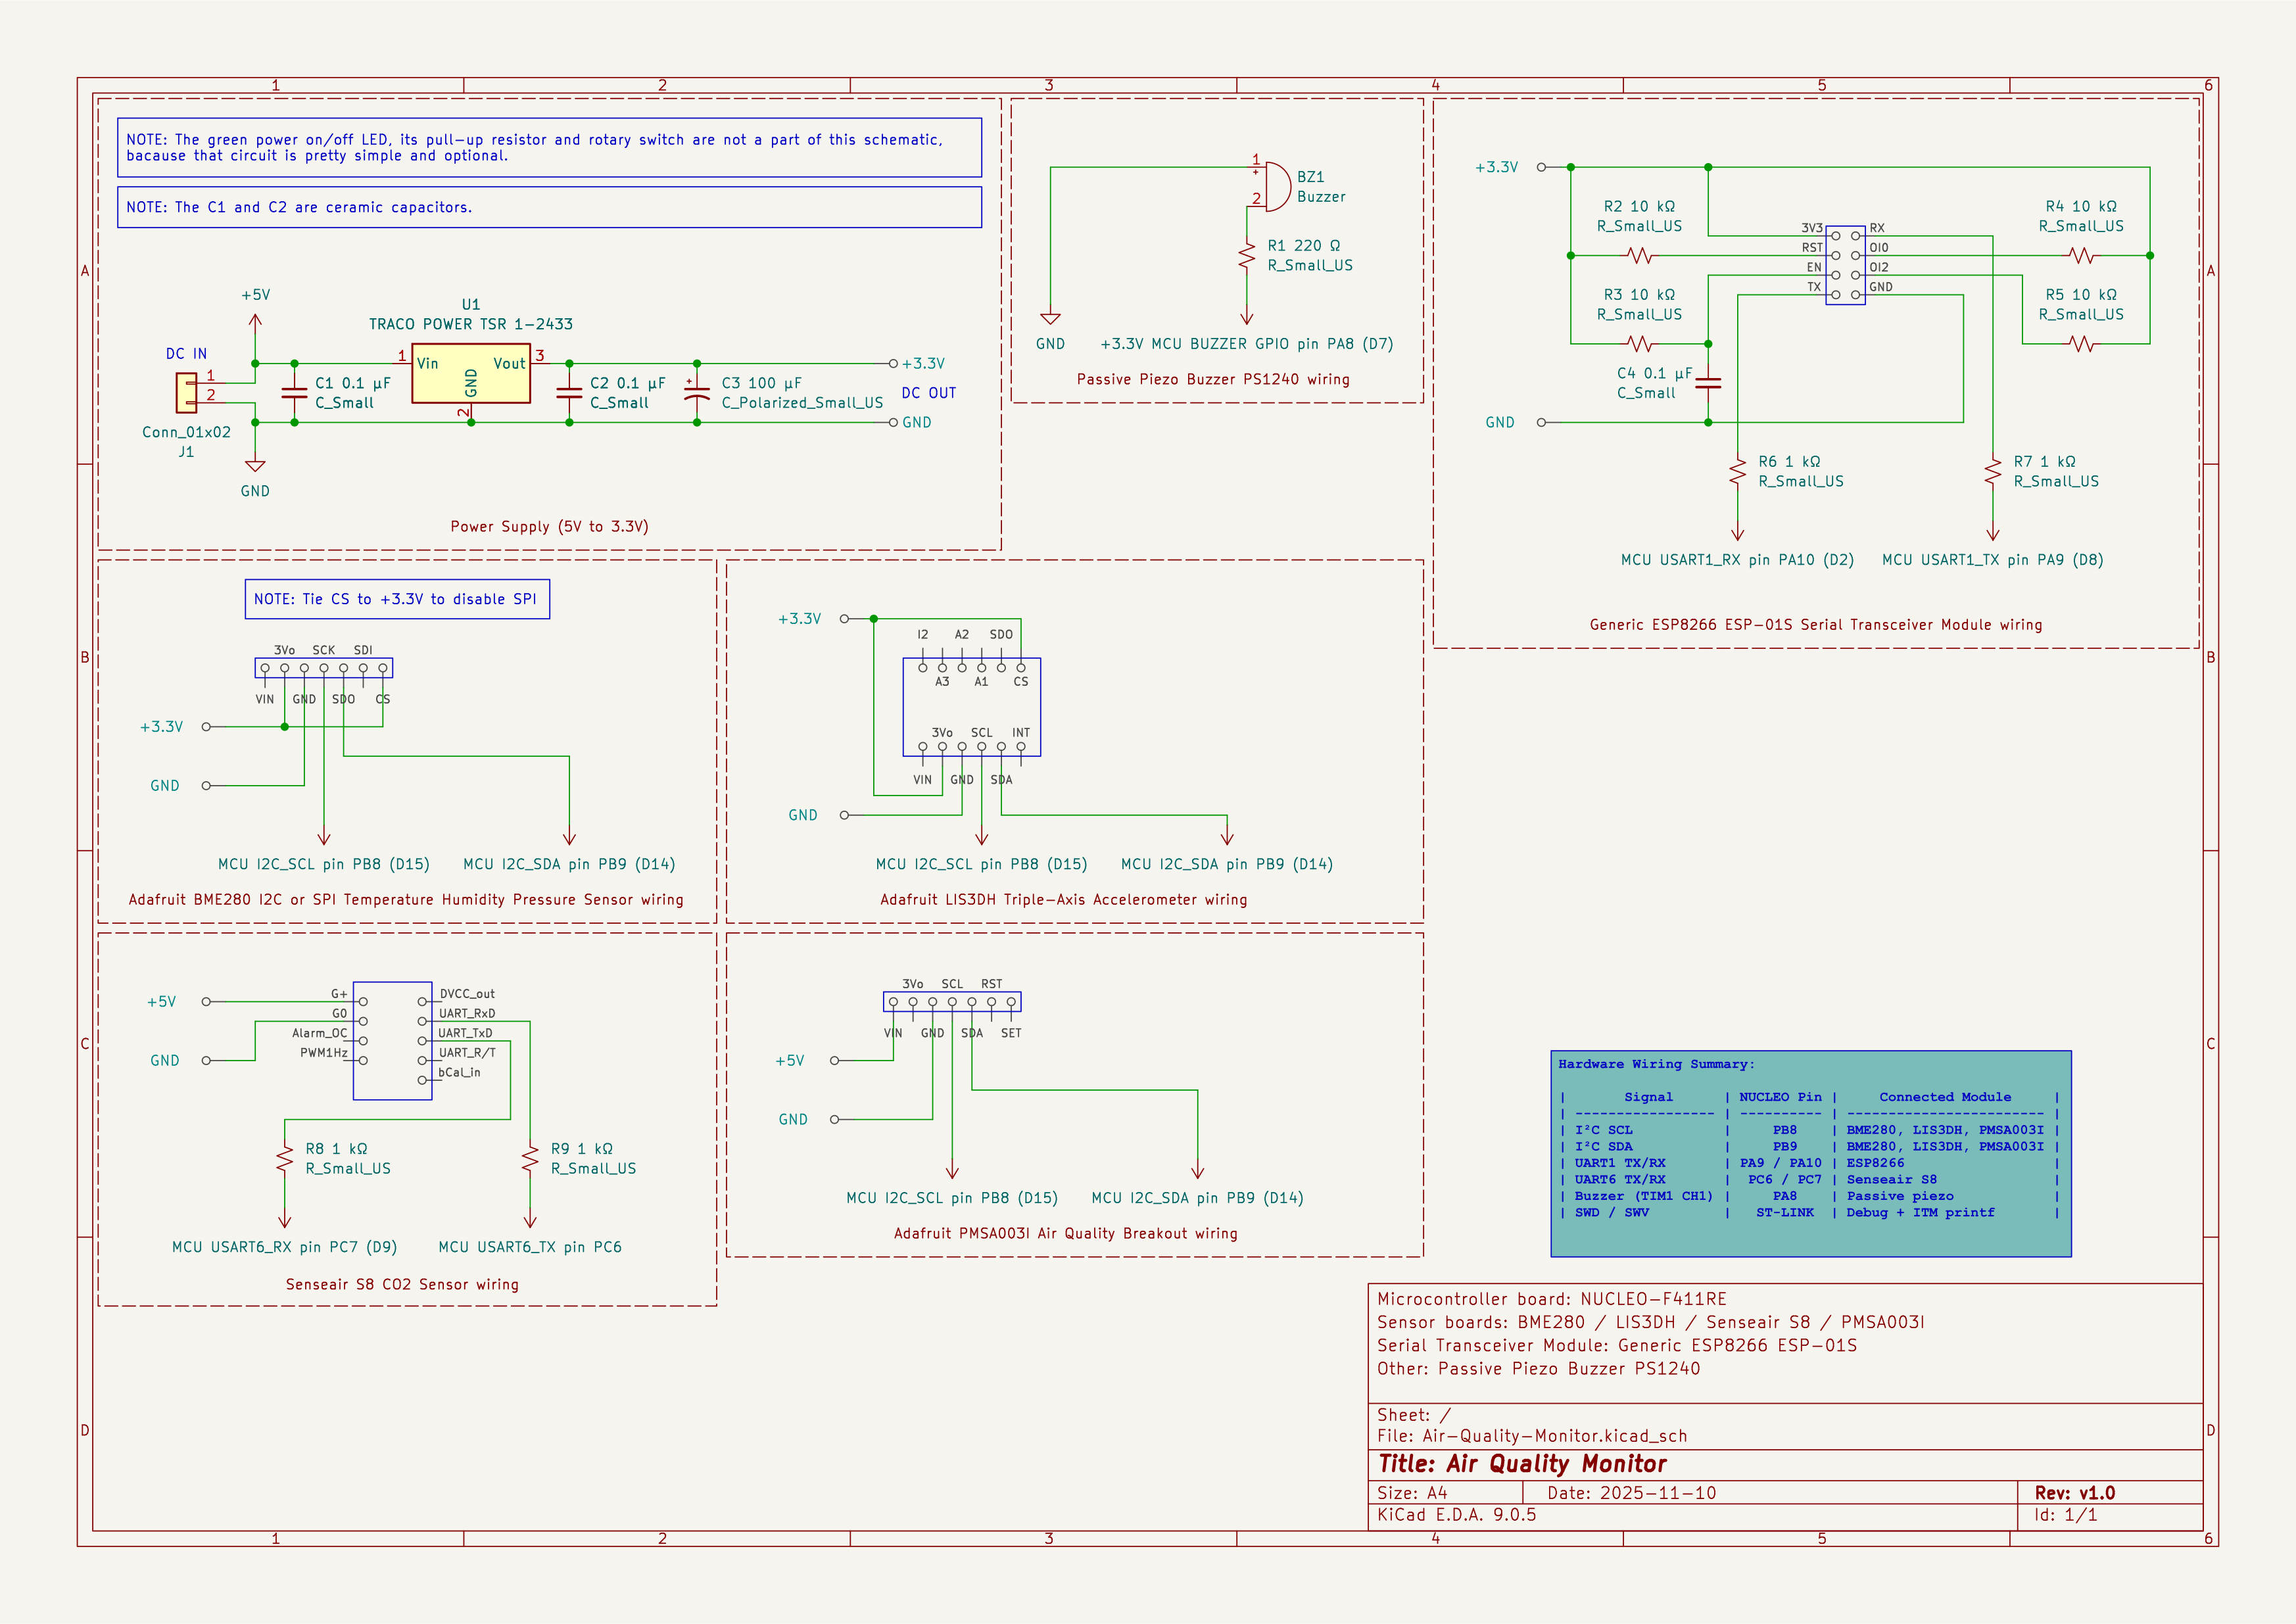
The electronic schematic of the prototype (Figure 1) was created in KiCad. It shows the wiring for all sensors, the STM32F411 Nucleo board, the ESP8266 ESP-01S module, the power circuitry, and the supporting passive components used in the build.
Figure 1:
Screen shots
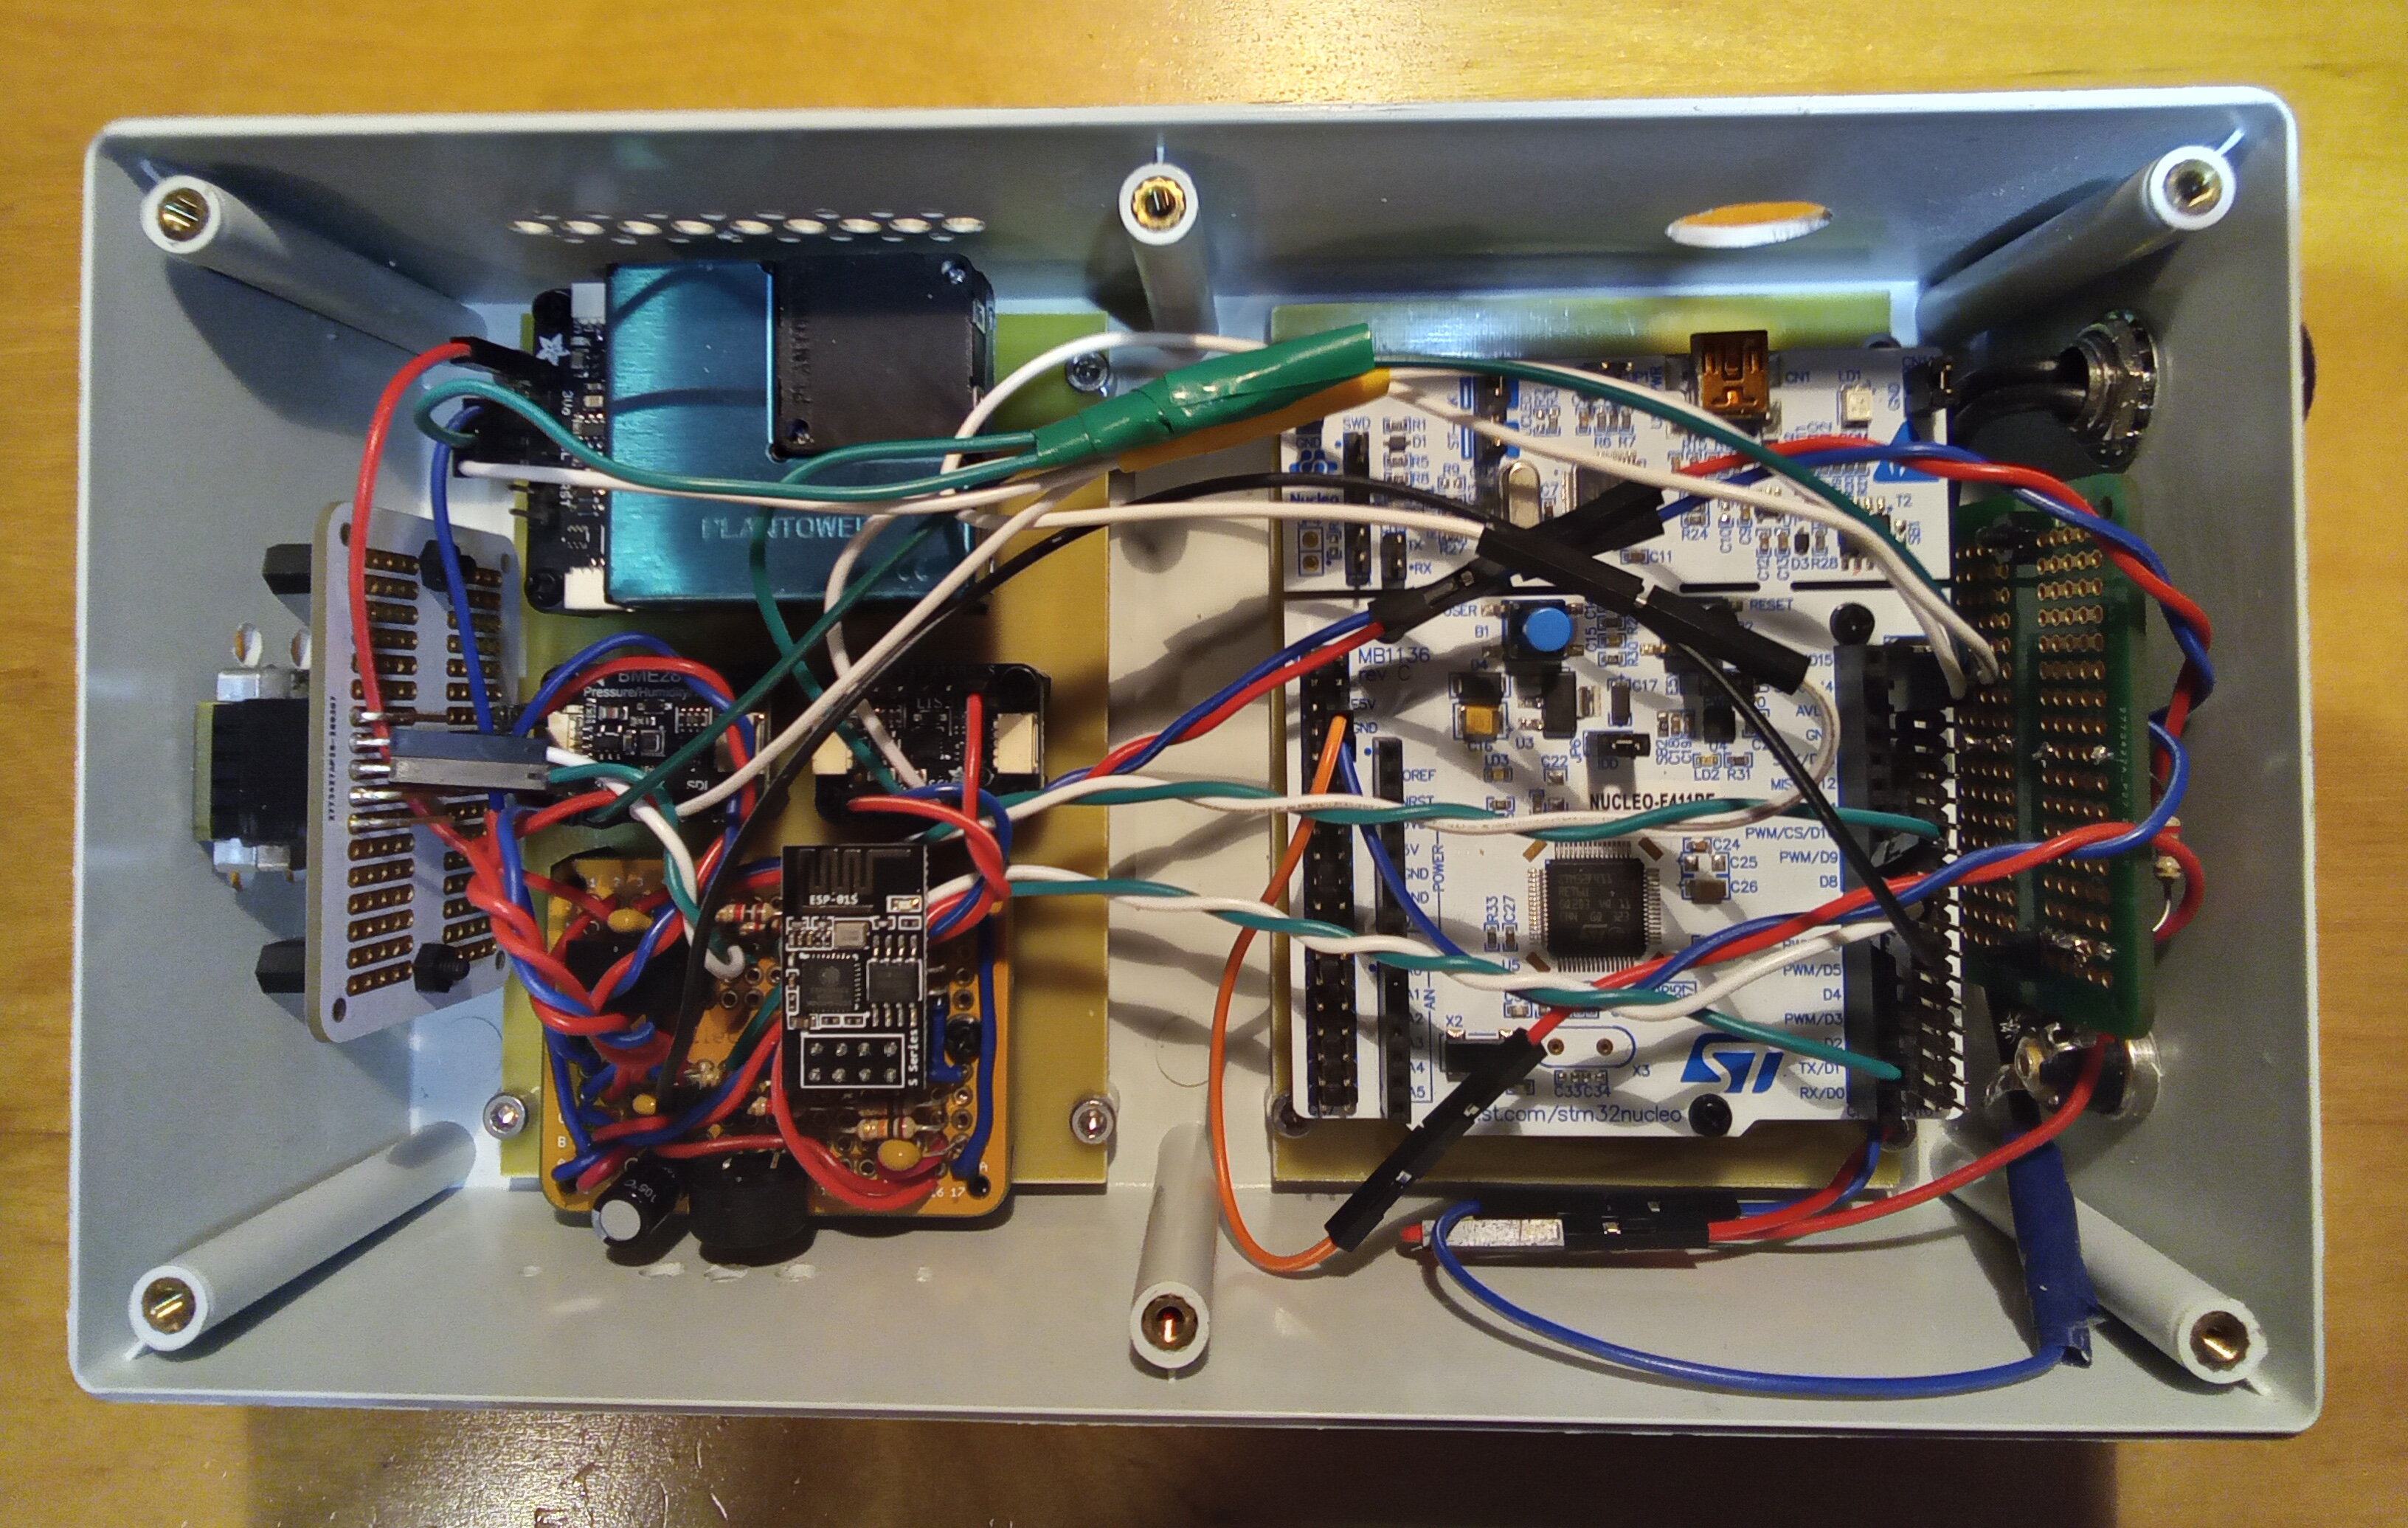
Prototype
Figure 2:
Firmware
These three sensors — BME280, LIS3DH, and PMSA003I — share the same I²C bus.
Figure 3 — I²C Clock (SCL) and Data (SDA) Signals Captured on an Air Quality Monitor
The oscilloscope capture below shows a typical I²C transaction between the STM32F411 microcontroller and the BME280/LIS3DH/PMSA003I sensors. Channel 1 (yellow) displays the I²C clock (SCL), while Channel 2 (purple) shows the data line (SDA). The capture was taken with both probes set to 10x attenuation, DC coupling, full bandwidth, and a 20 µs/div timebase.
The first rising edge marks the START condition, followed by a sequence of eight clock pulses corresponding to the address byte, and a ninth pulse for the ACK bit driven by the slave device. The SDA line transitions at the appropriate times - only when SCL is low — demonstrating correct I²C timing. Both SCL and SDA swing between 0V and approximately 3.3V due to the pull-up resistors on the bus.
This capture shows stable I²C communication at approximately 100 kHz.
Figure 3:
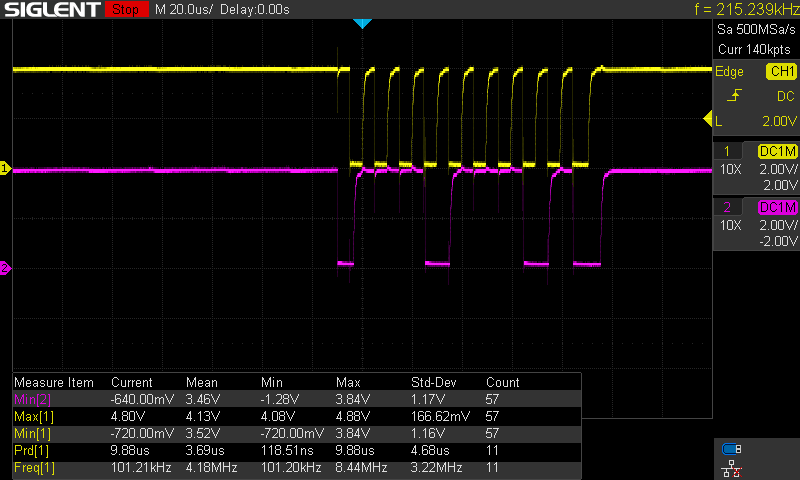
Figure 4 — Full I²C Read Burst (Address and Multiple Data Bytes)
This capture - using PulseView and Logic Analyzer (8-channel, 24 MHz) - shows a complete I²C read transaction from the PMSA003I particulate-matter sensor. The screenshot contains the Start condition (S), the write phase used to select the register, a Repeated-Start (Sr), the read phase, and the final Stop condition (P).
Figure 4:
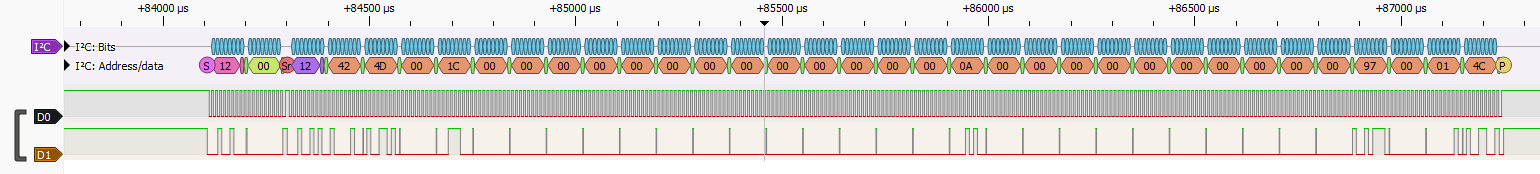
Figure 5 — I²C Register Write and Immediate Register Read (zoomed-in view)
This capture shows the two-phase sequence used by most I²C sensors: a short register write, immediately followed by a Repeated-Start + read.
Figure 5:
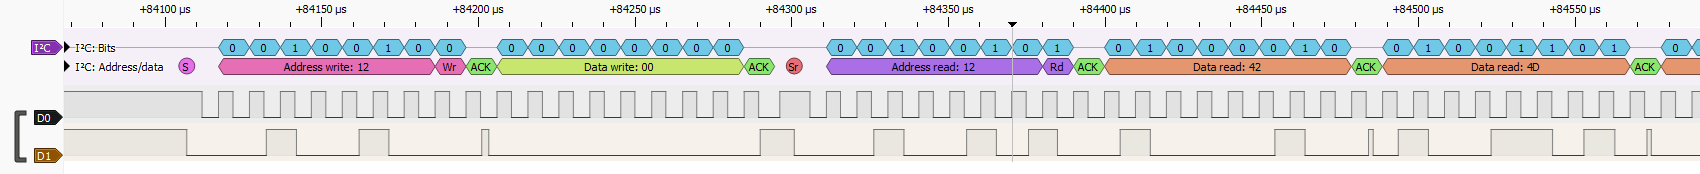
Figure 6 — BME280 I²C sequence
Figure 6:
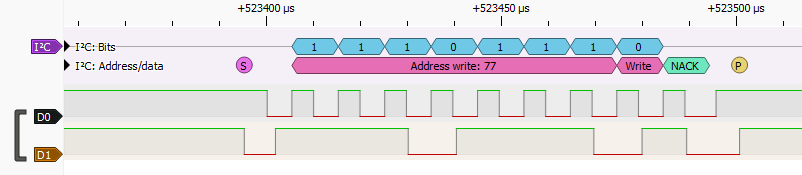
Figure 7 — LIS3DH I²C sequence
Figure 7:

Figure 8 — Senseair S8 UART Decoded Frame
This capture shows one full reply frame from the Senseair S8 CO₂ sensor over UART.
Figure 8:

Mobile app
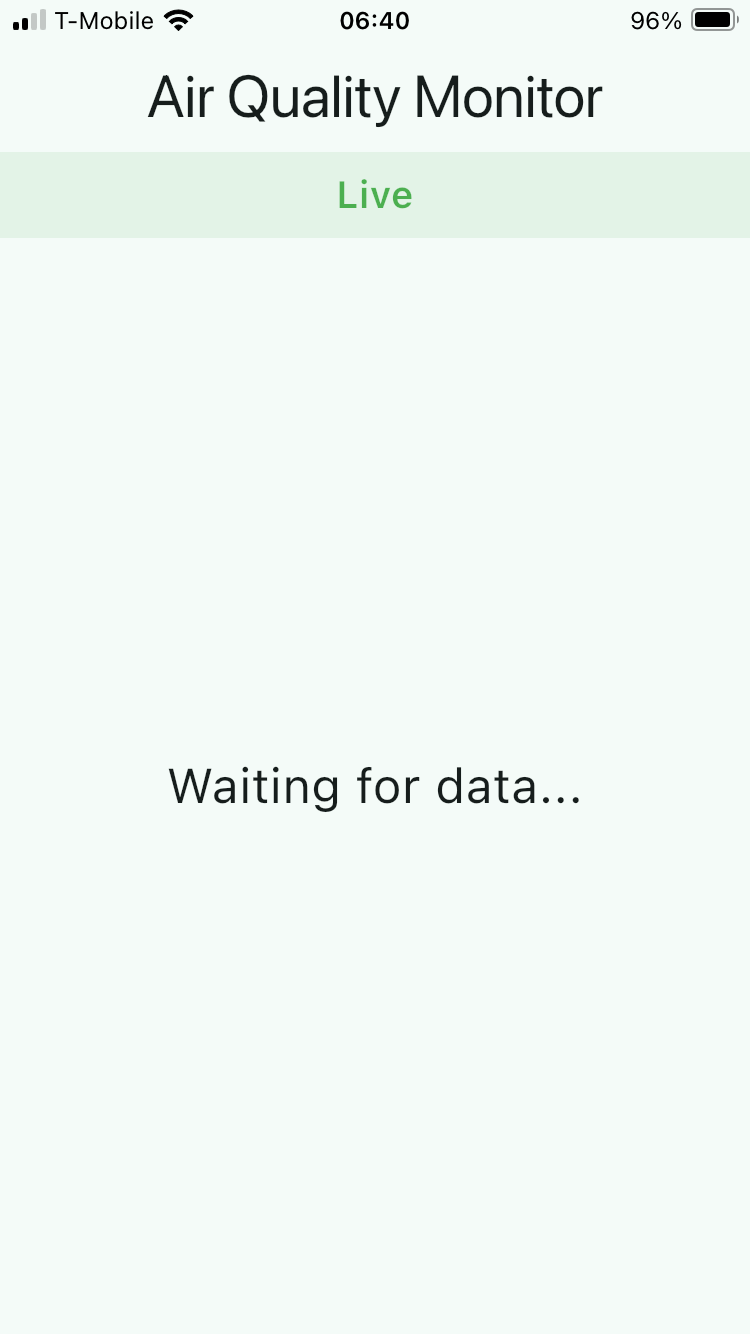
Initial view of the app
When prototype is off
Connected (prototype is on)
Telemetry data displayed
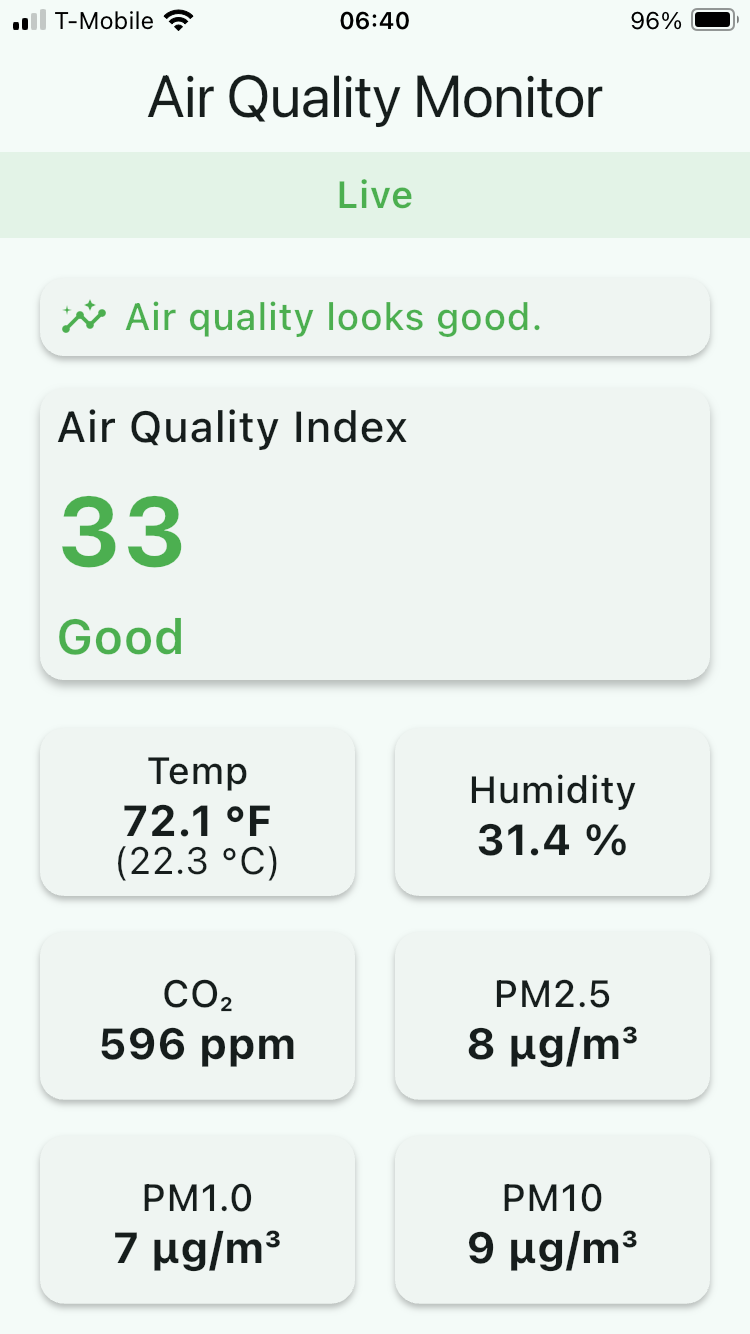
The app may display different messages depending on the AQI value:
- If AQI is less or equal to 50: “Air quality looks good.” (in green)
- If AQI is greater than 50 and less or equal to 100: “Air quality is acceptable for most people.” (in orange)
- If AQI is greater than 100: “Air quality is poor. Consider ventilation or filtration.” (in red)
Debug output
Firmware
Below is a console output from the Serial Wire Viewer (SWV) tab in STM32CubeIDE. The BME280 is found at address 0x12, LIS3DH is found at address 0x18 and PMSA003I – at address 0x77. The 192.168.1.208 is the IP address issued by the DHCP server on LAN. Once the prototype join the Access Point (AP), the buzzer will play the “ta-da” sound.
ESP: AT OK
ESP: joining AP (try 1/5)...
ESP: joined AP
ESP: server listening on port 5001
ESP (CIFSR raw, 71 bytes):
+CIFSR:STAIP,"192.168.1.208"
+CIFSR:STAMAC,"24:d7:eb:ec:ff:32"

OK
ESP: STA IP = 192.168.1.208
ESP: waiting for client... (nc 192.168.1.208 5001)

I2C scan start...
- Found 0x12
- Found 0x18
- Found 0x77
I2C scan done.
0x77 chip_id = 0x60 (60=BME280, 58=BMP280)
0x18 WHO_AM_I = 0x33 (expect 0x33)
0x12 present (PMSA003I)
Init BME280...
BME280 init OK
LIS3DH init OK
LIS3DH calibrated.
S8 slave=0xFE

T=23.26 C, P=994.9 hPa, RH=44.0 %
X=0.001 g Y=-0.001 g Z=1.047 g | pitch=-0.1 deg roll=-0.1 deg
PM1.0= 0 PM2.5= 0 PM10= 0 ug/m3 | 0.3um=9 0.5um=9 1.0um=0 2.5um=0 5.0um=0 10um=0 ver=151 err=0
AQI=0 (Good) PM2.5=0 PM10=0 ug/m3
CO2 = 688 ppm
TELEMETRY:
{"T":23.26,"P":994.9,"RH":44.0,"AX":0.001,"AY":-0.001,"AZ":1.047,"PM1":0,"PM25":0,"PM10":0,"CO2":688,"AQI":0,"AQIcat":"Good"}
ESP: no client; connect with: nc 192.168.1.208 5001
Once the client (mobile app) connects, the prototype will beep once and the following line will be printed:
ESP: client 0 (via CIPSTATUS)
And when the client gets disconnected, no sound is played and the following line will be printed:
ESP: client 0 disconnected (send failed: link not valid); dropping link
Error handling: the prototype plays different sounds in case of errors.
- If it cannot join AP for whatever reason, the "fail sound" (downer) will be played.
- If BME280 initialization fails, 2 short beeps will be played.
- If LIS3DH initialization fails, 3 short beeps will be played.
- If the ESP8266 did not pass the test after the initialization, 4 short beeps will be played.
The prototype uses UDP only for device discovery and TCP for the continuous telemetry stream. UDP is ideal for discovery because it allows the mobile app to broadcast a single probe and quickly receive the device’s IP address and port. However, UDP is not reliable for sustained data transfer and is heavily restricted on platforms like iOS, especially when apps go into background mode.
For this reason, all real-time telemetry is delivered over TCP, which guarantees delivery, ordering, and stable long-lived connections. The firmware periodically polls the ESP8266 with AT+CIPSTATUS to detect active or closed TCP links, because relying only on unsolicited AT messages (such as ,CONNECT or ,CLOSED) is not sufficiently reliable on the ESP8266.Mobile app
The mobile app receives the telemetry JSON from the prototype, like this:
{"T":23.45,"P":1013.2,"RH":45.3,"AX":0.001,"AY":0.002,"AZ":0.003,"PM1":4,"PM25":7,"PM10":10,"CO2":650,"AQI":42,"AQIcat":"Good"}
The app currently has a single view that displays:
- Big, easy-to-read AQI and category (“Good/Moderate/Unhealthy... etc.”)
- Secondary numbers (T, RH, CO₂, PM2.5) in simple cards
- A small status area (“Connected / Connecting / Offline”)
Up to 4 clients (apps) should be able to connect to the prototype.
The app:
- Broadcasts DISCOVER_AQM.
- Parses AQM_REPLY.
- Builds TelemetryService
flutter: The Dart VM service is listening on http://127.0.0.1:52064/p43fSzd3STA=/
flutter: Discovery: available IPv4 interfaces:
flutter:   - iface pdp_ip0: 192.0.0.2 (loopback=false)
flutter:   - iface en0: 192.168.1.229 (loopback=false)
flutter:   - iface en2: 169.254.119.54 (loopback=false)
flutter: Discovery: chosen local IP = 192.168.1.229
flutter: Discovery: scanning 253 hosts on port 5001
flutter: Discovery: probing batch 1..16
App is being debugged, do not track this hang
Hang detected: 0.52s (debugger attached, not reporting)
flutter: Discovery: probing batch 17..32
flutter: Discovery: probing batch 33..48
flutter: Discovery: probing batch 49..64
flutter: Discovery: probing batch 65..80
flutter: Discovery: probing batch 81..96
flutter: Discovery: probing batch 97..112
flutter: Discovery: probing batch 113..128
flutter: Discovery: probing batch 129..144
flutter: Discovery: probing batch 145..160
flutter: Discovery: probing batch 161..176
flutter: Discovery: probing batch 177..192
flutter: Discovery: probing batch 193..208
flutter: Discovery: found device at 192.168.1.208:5001
flutter: TelemetryService: connected to 192.168.1.208:5001
flutter: TelemetryService: RX bytes = 127
flutter: TelemetryService: RX chunk = {"T":25.72,"P":997.8,"RH":38.0,"AX":0.001,"AY":-0.001,"AZ":1.049,"PM1":0,"PM25":0,"PM10":0,"CO2":626,"AQI":0,"AQIcat":"Good"}
flutter:
flutter: TelemetryService: buffer length now 127
flutter: TelemetryService: JSON candidate = {"T":25.72,"P":997.8,"RH":38.0,"AX":0.001,"AY":-0.001,"AZ":1.049,"PM1":0,"PM25":0,"PM10":0,"CO2":626,"AQI":0,"AQIcat":"Good"}
flutter: TelemetryService: parsed telemetry T=25.72, P=997.8, RH=38.0, AQI=0
flutter: TelemetryService: RX bytes = 127
flutter: TelemetryService: RX chunk = {"T":25.70,"P":997.8,"RH":37.9,"AX":0.001,"AY":-0.001,"AZ":1.049,"PM1":0,"PM25":0,"PM10":0,"CO2":626,"AQI":0,"AQIcat":"Good"}
flutter:
flutter: TelemetryService: buffer length now 129
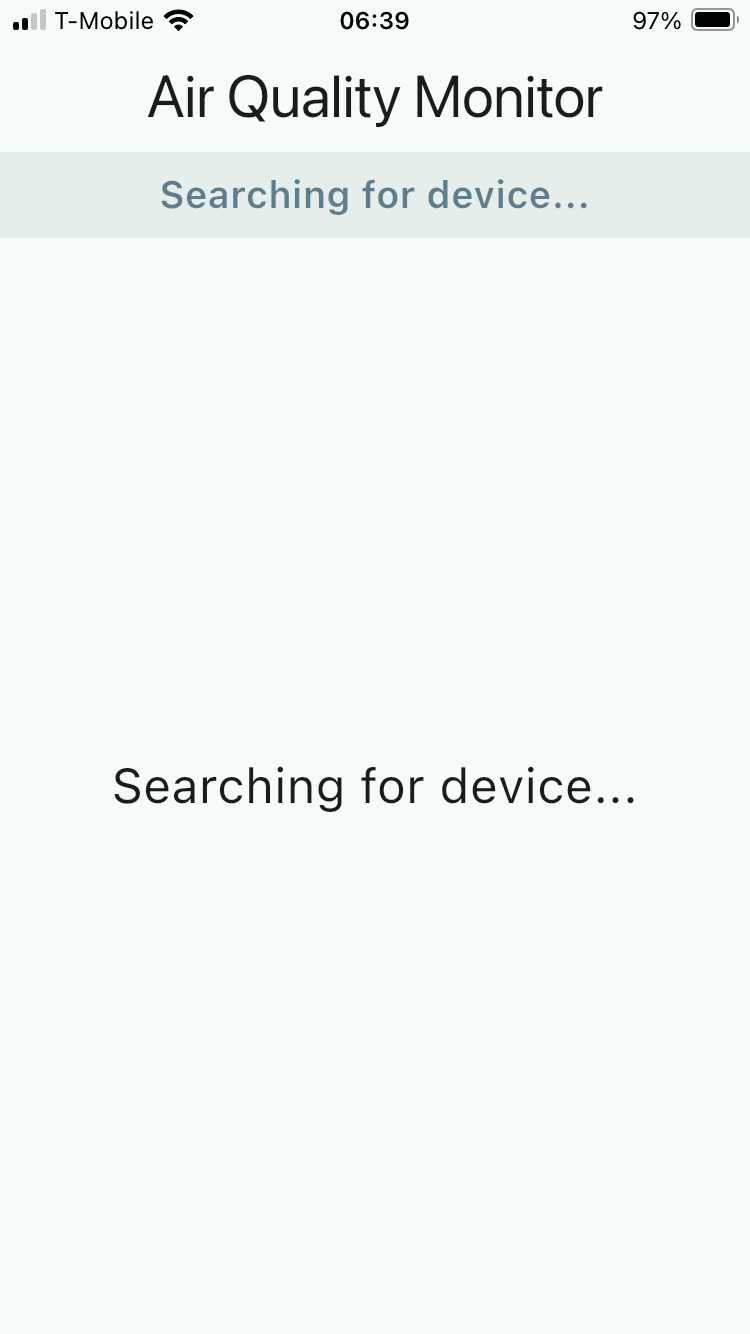
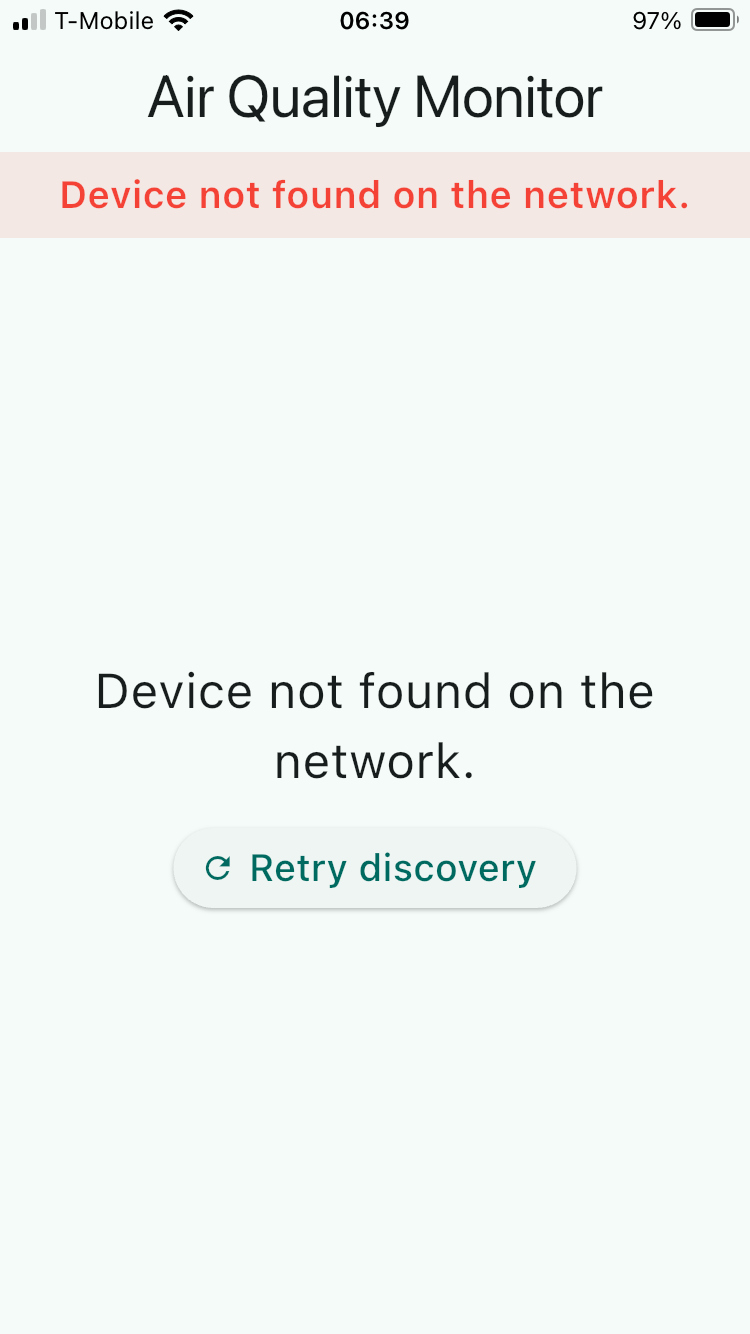
Demo
In the video demo below, the mobile app is started before the prototype is powered on. Since the device is not yet online, the app attempts to discover it on the network but cannot find it. Once the prototype is turned on and finishes connecting to Wi-Fi, tapping the Retry Discovery button makes the app scan again, and this time it successfully detects the device.
As the air conditions change — for example, when rosin flux vapors are present — the readings in the app begin to update in real time. You can see the AQI and related sensor values gradually shift as the particulate levels in the air increase and then settle back down.Source code
The GitHub repositories are private at this time, but all code is available for download below as ZIP files.
Downloadable files
What's next / Wish list
There are several ways this prototype can be expanded and improved. Most of these do not require major hardware changes and can be added gradually as the firmware and mobile app evolve.
MQTT Support and Home Assistant Integration
One of the next logical steps is adding MQTT as an optional communication method. With MQTT, the prototype could publish telemetry to a local broker (Mosquitto, EMQX, etc.), and Home Assistant could automatically discover the device through MQTT Auto-Discovery. This would allow all sensor values — temperature, humidity, PM2.5, CO₂, AQI, and even accelerometer data — to appear automatically as entities inside Home Assistant without any manual configuration.
FreeRTOS / RTOS Integration
Right now the firmware runs without an RTOS, which is fine for early stages. Later, introducing FreeRTOS would allow the firmware to split work into dedicated tasks — sensor polling, ESP8266 communication, telemetry generation, error detection, buzzer feedback, etc. — all running independently. This would make the system more robust and easier to expand without timing conflicts.
OTA (Over-the-Air) Firmware Updates
Another major upgrade would be support for OTA firmware updates. The ESP8266 can download firmware images and pass them to the STM32, or the STM32 itself could implement its own OTA mechanism. This would allow new features, calibration tweaks, or bug fixes to be deployed without opening the enclosure or connecting a USB cable.
Data Logging and Visualization
The device could periodically push telemetry to a time-series database such as InfluxDB, Prometheus, or a lightweight local server. From there, a Grafana dashboard could be used to visualize long-term patterns — CO₂ spikes, humidity changes, PM events, seasonal trends, and more. This would make the system useful for long-term environment tracking and indoor-air analysis.
Predictive Logic and AI-Based Analysis
With enough historical data, the system could start predicting trends:
- Expected CO₂ rise based on occupancy,
- Likely PM spikes,
- Ventilation timing recommendations,
- Anomaly detection (for example, vibration deviations or sudden environmental changes).